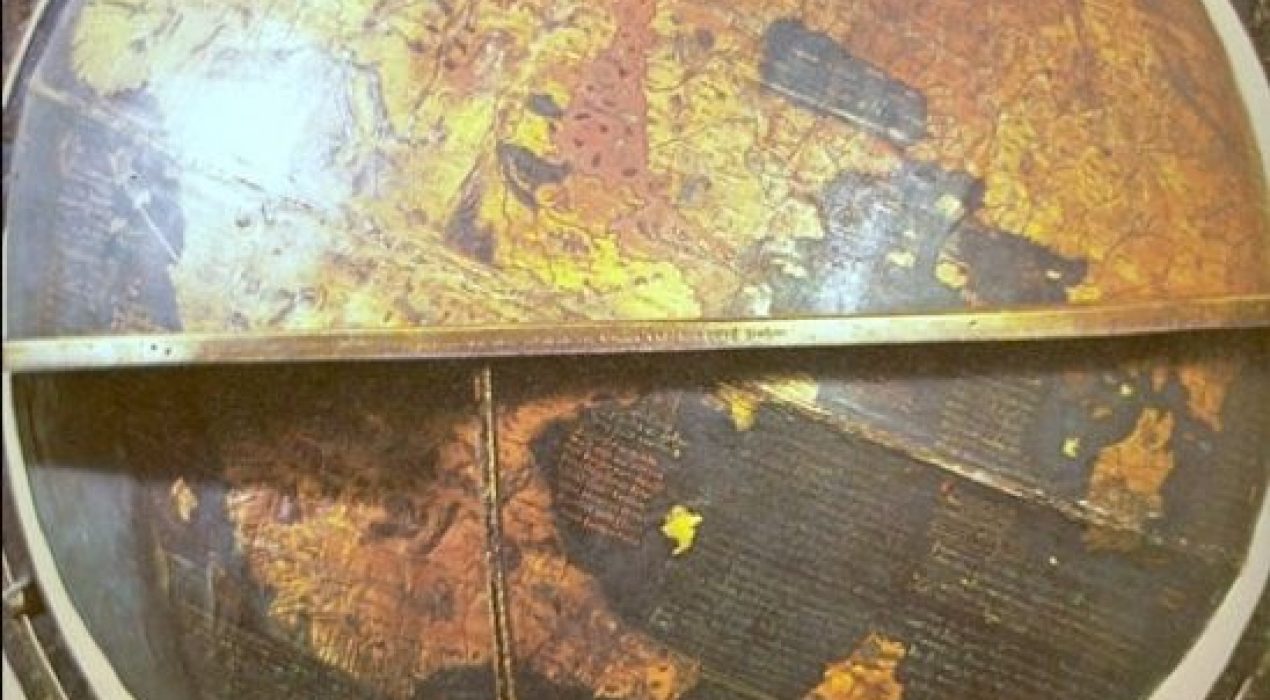
The Oldest Surviving Globe — 12/27/20


The Phantom Island of Hy-Brasil – 09/28/20


Voyages of Capt Cook – 04/15/20


Wallachia, Transylvania and the Real Dracula – 1/13/20
Mapping the Apollo 11 Landing Site – 7/


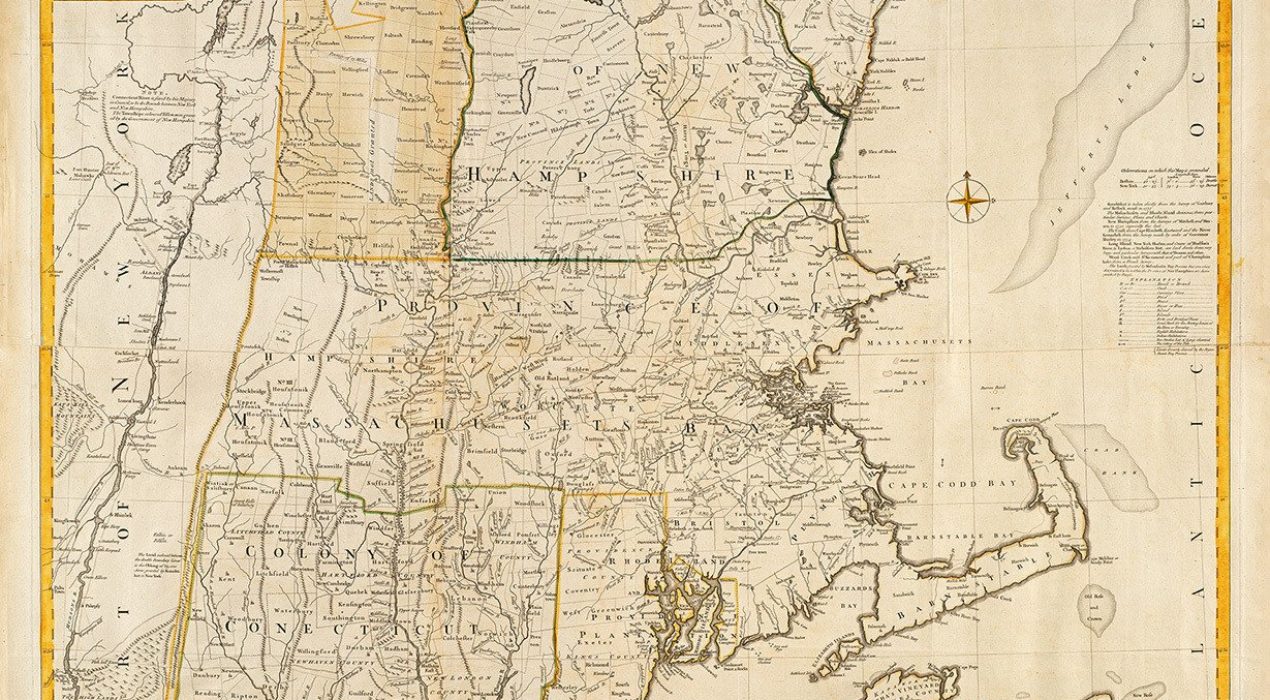
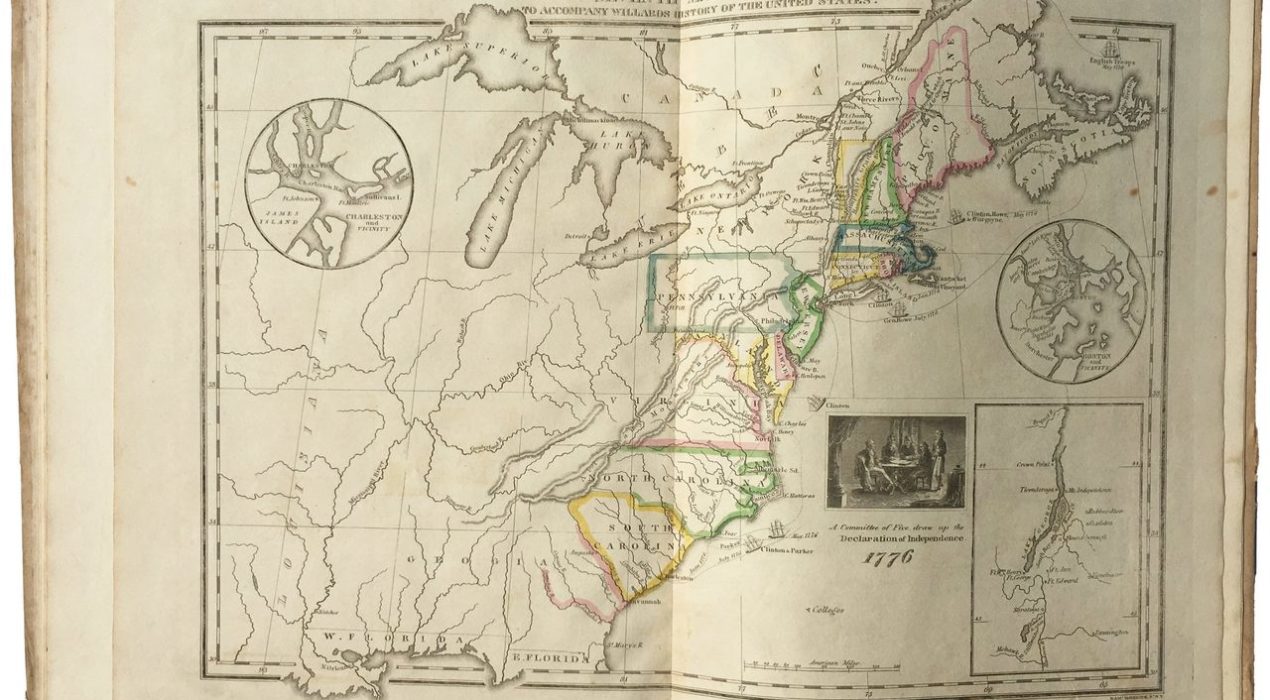
Mapping a Revolution – 7/3/19


United Nations of Pangea – 6/12/19
America’s First Female Mapmaker – 6/7/19
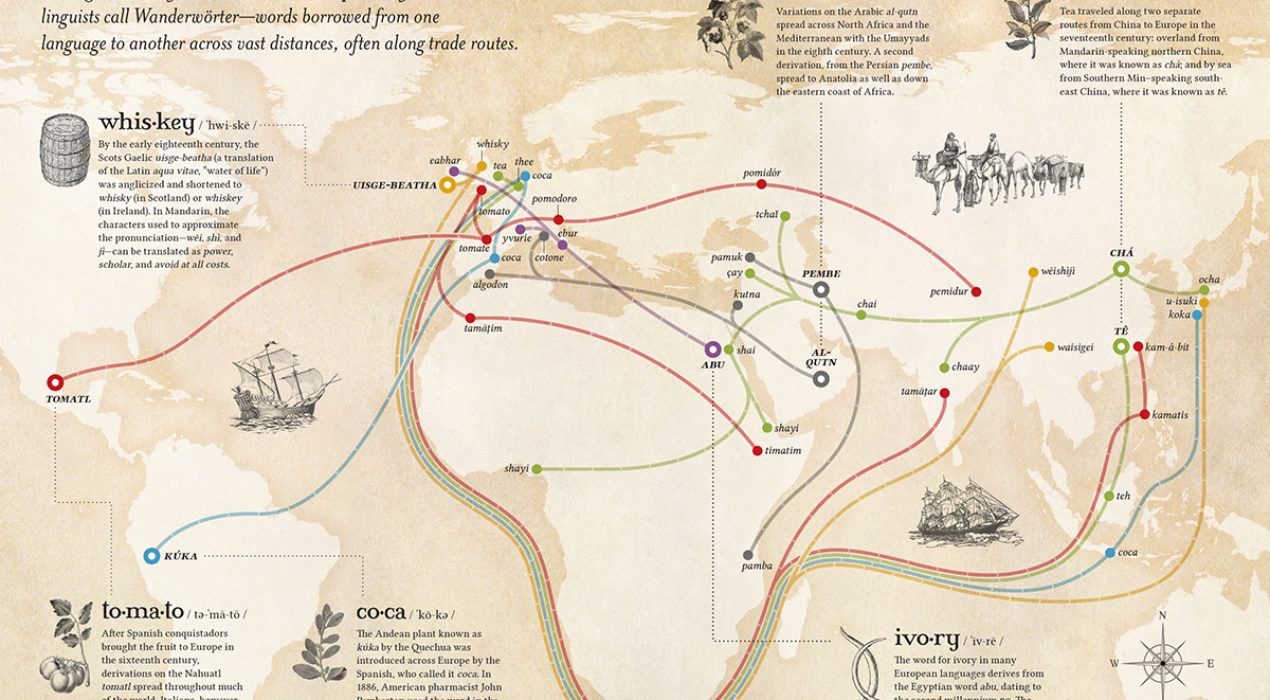
Mapping Wanderwörter – 3/6/19


Visualizing the Moon, Pt. 2 – 3/4/19
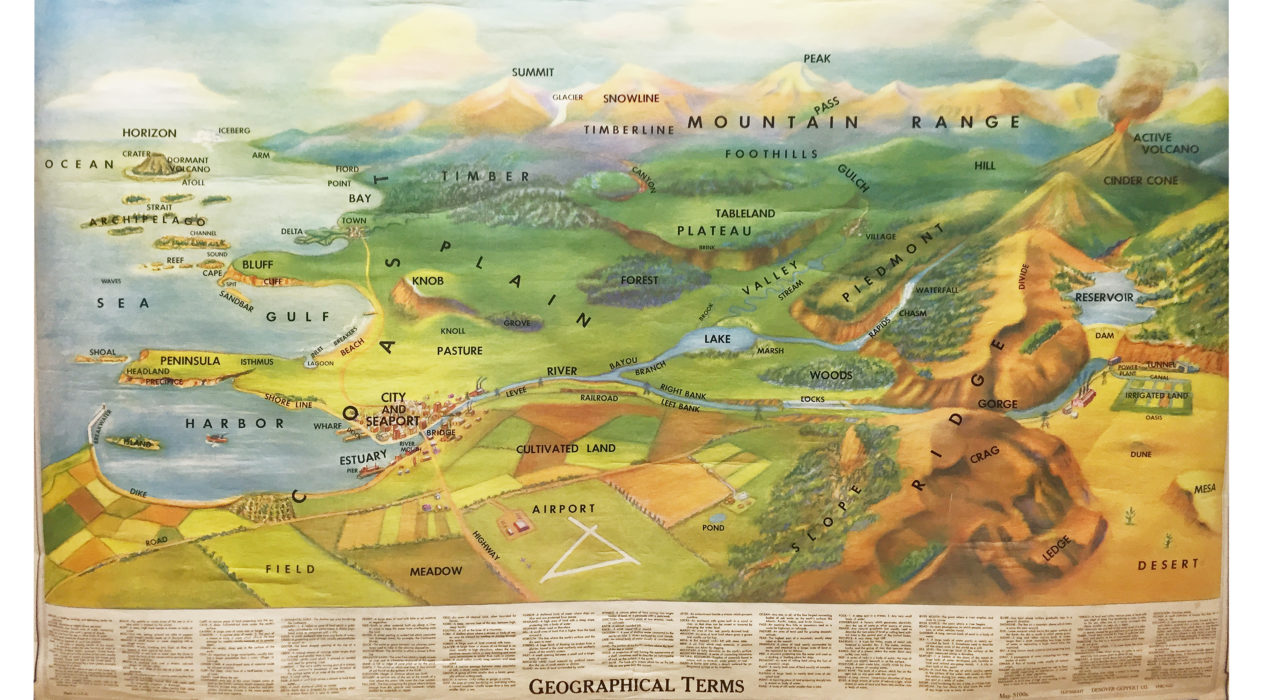
Geography Quiz! – 3/28/19


Mapping a Migraine – 3/4/19


Literal Translation of Country Names – 2/2/19
The Truth About Maps – 1/2/19
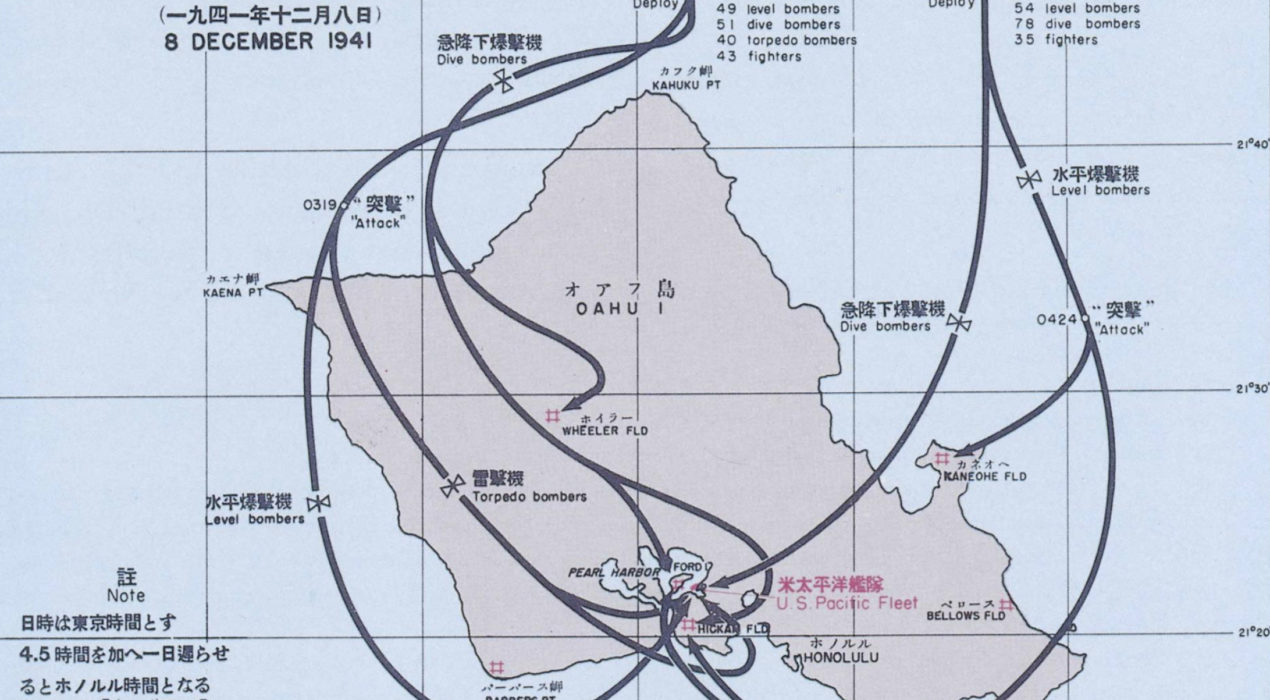
Map of Attack on Pearl Harbor – 12/7/18