

Using Art + Design for More Interesting Map Layouts
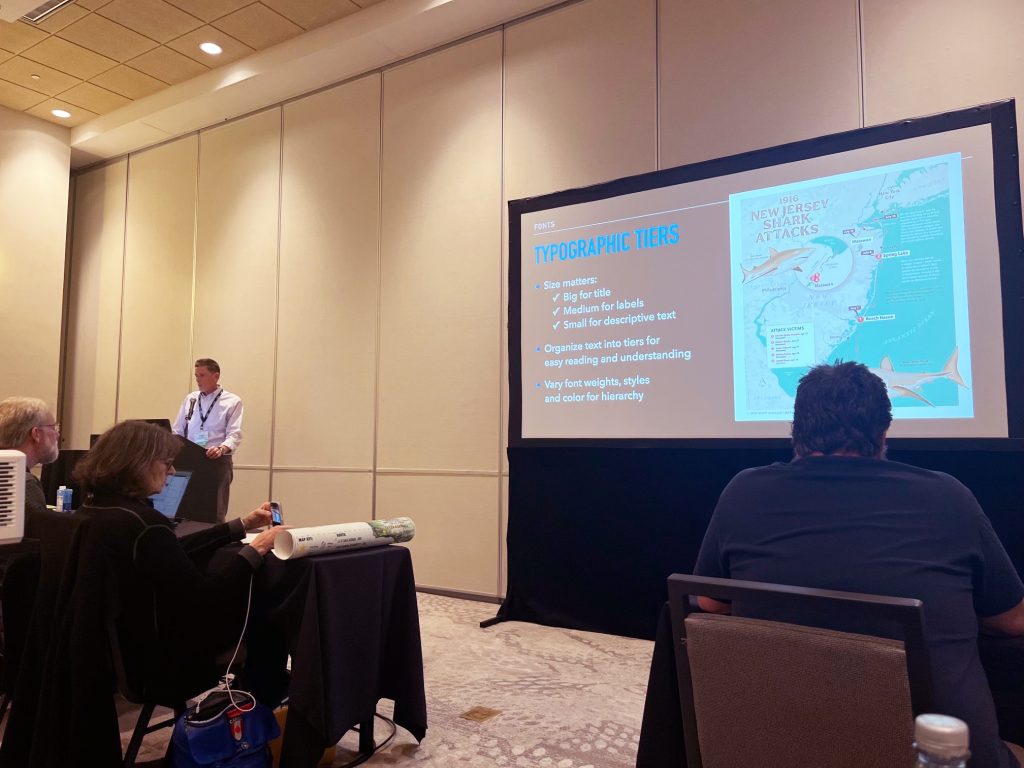
Speaking in the Art & Design session on Friday, Oct. 23, 2026
The following is a transcript from my presentation at the Hyatt Regency Hotel in Milwaukee, Wisconsin, Oct. 23, 2026.
For a PDF of the slideshow itself (no text), click here.
To view a video recording from the conference, click here.
Hello and welcome to Milwaukee!
I’m excited to be here to talk today about using art & design to help create more interesting map layouts.
INTRODUCTION
• I’ll begin with this question: Have you ever wondered why some map layouts just look so good? They seem to trigger a curiosity and pull you in for a closer look. They’re “alive” in a way, not by being interactive or animated, but in a way that moves your eyes around the page and stirs something inside you. This is what we’ll explore a little further.
• First, a definition: “The map layout is the arrangement and design of the elements associated with a map on a page or screen, typically for a poster or presentation. These elements, also called the marginalia, support the map, and consist of various things such as the title, legend, labels, compass rose and others. The map body is the primary image, of course, with the supporting elements placed around it in some fashion.
By thoughtfully designing and arranging them, the whole layout becomes greater than the sum of its parts, transforming geographic data visualization into a form of cartographic storytelling.
• If a map tells us the WHAT and WHERE, then the job of a layout is to tell the WHY. And the best layouts have a map whose underlying purpose is clear. so the goal is to arrange and style everything on the page in a way that reinforces that main message. It should have crisp type and simple colors that create an easy to follow hierarchy…some negative space to prevent crowding…and an overall composition that gently moves the eye from one place to another. These layouts seem to skillfully blend science and art, data and beauty, facts and concepts.
• Sometimes brilliant ideas come to us out of nowhere, like a bolt of lightning. It’s electrifying to feel the parts of a project coming together. As creative guru Rick Rubin puts it, “these aha! moments illuminate our way.” And it pays to follow that path and see where it leads.
• This is maybe what it must feel like to be a mad scientist in the lab…daring to defy convention…trying new things without fear of failure…exploring new combinations…doing things in our own way. Not unlike Dr. Victor Frankenstein, we believe in our quest and trust the process to get the result we want.
• Keeping all of this in mind, let me now introduce 5 techniques that can help make map layouts more narrative and visually appealing.
They are:
- Fonts
- Color
- Arrangement
- Art
- Golden Ratio
Let’s look first at fonts…
FONTS
• Choosing and using the right typeface can organize complex information while also shaping the tone of your message. But, this is more than just selecting a font from a drop-down menu; it’s more about creating a unified visual rhythm that makes the text read and flow well throughout your design.
The title is typically the first thing people read, so I like to make it eye-catching and interesting. But with so many fonts available out there, what will look best? Serif, sans serif, script, modern, display? — each one has its own unique qualities and personalities, it’s fun to experiment with them to see which ones best communicate the story of the map. When you find the right one, it adds another layer of visual interest to the layout.
• Scaling the size and weight of your type lets you organize information into tiers, or levels of understanding. When done well, your type will inform the reader what to look at first, without them having to think too much about it. Large type for the title is easiest to read and captures the overall mood. Medium size type for second-level text, with smaller sizes for descriptions and annotations. Readability is always a top priority, so it’s critical to test the size, color, weight and style of your type to achieve the best results.
COLOR
• Another way to breathe life into your layout is through color. Thanks again to Elaine and Jim for pointing out how color choice plays a such big role in mapping.
• It is said that we only have 3-8 seconds to capture a viewer’s attention. In this very brief window, your use of color will help the viewer quickly process the information in the layout. Effective use of color does many things, like create a mood, direct attention and simplify data. Color use also serves to create balance, and harmony, or make some elements stand out from the others in interesting ways.
• A few tips when choosing a color palette for a layout:
Repeat the map colors in other elements of the layout. This helps to unify all the various map elements.
Using too many colors can make the layout distracting or confusing, so be consistent with how and where you use colors throughout your design to create a cohesive visual language.
Recognize the meaning of different colors and utilize it to create the tone you’re looking for. Color influences our moods, feelings and behaviors (often without us even knowing it!). For example, warm colors can increase excitement and energy, while cooler colors tend to be more quiet and soothing.
The psychology of color is a powerful tool you can use to influence mood or prompt action, and using it effectively can really help you connect with the audience in a subtle way.
ARRANGEMENT OF ELEMENTS
• By avoiding sharp divisions between map elements, everything on the page seems to fit nicely. All of the elements relate to one another in a way that’s a pleasure to look at. Objects are in proportion to one another, giving the design balance and arousing a certain curiosity.
• Integrating negative space also prevent layouts from looking crowded. This space serves as an “invisible river” that gives key elements room to breathe and flows around the page creating a sense of ease. It’s best not to push elements to the edges…instead, let openness serve as a frame to contain and focus attention on the most important features, so nothing feels confined and everything remains readable.
• Knowing where to place elements in the layout can be helped by using a grid. This is an instance where “thinking INSIDE the box” can be very useful.
The grid is an underlying framework that guides your placement of elements. Here are some of the most common grids used by designers and photographers. Once you determine a focal point and choose an appropriate grid, just line up the map elements along the lines, at intersections of lines or inside individual compartments. Using off-center placement, odd-number groupings and strong line patterns creates a natural and energetic flow that keeps the viewer engaged.
• Here I used the Vanishing Point grid to focus attention on the map’s subject — the white pelicans. They’re placed slightly off-center, with the other lines leading to them, and the title.
• And here I used a Golden Spiral grid, which connects the legend, to the inset map, the title and the illustration of the tern.
ART
• Speaking of illustrations, the next technique is the use of art in your layout.
• Our brains processes images 60,000x faster than reading text, impacting our emotions well before it registers as a thought. So, including art in your layout can be a sure-fire way to grab attention, and hold it. Illustrations or photos add value as an unexpected surprise and delight, but they should be intentional — not added just as decoration. It should feel like an extension of the map, another valuable component that adds to the whole. They also make your layout more memorable and can help you establish your own trademark style.
• One thing I love about using illustrations is that it lets me choose a visual style that matches the map itself…these art elements can add a pop of color, sort of a “Wow!” factor that compels the viewer to stop and study everything…An illustration can focus attention on one spot, OR lead the eye around the page to other areas.
• There are many styles of illustrations to consider, but it’s often best to match it to the look of the map: it could be realistic or abstract. It could be digital or handmade. It could even be black & white. Whatever style you choose, you’ll just want to be sure it doesn’t compete or distract from the map’s main purpose.
The same is true for any photos you place in the layout — size, color and cropping of photos should work seamlessly with the other surrounding elements.
GOLDEN RATIO
• I’ve saved the best for last: and this one is my favorite, because it incorporates and unifies all the others I just covered. It’s called the Golden Ratio.
• It’s an invisible thread woven throughout the natural world, so it’s no surprise that it feels so familiar to us. It explains why some designs just “feel right”, while others look off, or lifeless. And once you see it, you can’t unsee it.
• The Golden Ratio is a mathematical ratio, or proportion, that has an inherently organic and pleasing look. Known by other names like Phi, and the Divine Mean, it’s represented by the number 1.618. It’s closely tied to the famous Fibonacci Sequence, because as you divide any Fibonacci number by the one immediately before it, the result gets closer and closer to phi.
• In the simplest of terms, this ratio is two parts that are in harmonious proportion to each other, and to the whole. Visualize “a line segment divided into two unequal parts…if the ratio of the whole line to the longer segment is equal to the ratio of the longer segment to the shorter one, then it is the Golden Ratio. It’s a fairly simple ratio yet is capable of creating limitless variety and complexity. Graphically, it creates a Golden Spiral that shrinks or expands infinitely, as well as creating proportional rectangles, triangles and circles…all of which can be used in a grid.
• It is the secret code of the universe and is literally everywhere you look — it exists throughout nature, it’s used by fine artists, architects, musicians, designers and photographers. It has been proven effective in computing, finance and trading…it’s even present in human anatomy, from our hands and faces, down to the structure of our very DNA.
• So why use the Golden Ratio in your layout? Well, it can create a sense of order and stability that strikes a familiar chord with the viewer. And it serves to guide the placement of the map and its various elements. Since our aim is to create a clear connection of the map features to the map itself, the Golden Ratio the perfect complement, as it does that very thing.
• Here are a few examples where I’ve used the Golden Ratio in the composition…
When I overlay the Spiral over my layout, you see how the spiral creates a very organic connection between the map and all its features. It’s an interesting and beautiful solution.
• You can rotate the Spiral, flip it around, make it larger or smaller, you can even have more than one. It’s completely up to you! On the left, note how the Spiral actually connects Milwaukee on the map to the globe view. And on the right, the Spiral connects the three most important temples of ancient Greece (that’s not an accident by the way, they actually intentionally built them with the Spiral in mind!). So I encourage you to try this out on your own projects and see what kind of magical results emerge.
• You can apply this proportion to everything I’ve previously mentioned: in your type sizes, in your color palette, in the placement of your art and in the underlying grid. In the final layout, the eye perceives the finished pattern as a whole, and it is becomes “alive” with movement. If movement is absent, none of the other qualities the layout may possess will resonate as much in the viewer.
CLOSING
• I hope you found these techniques inspiring and worth trying out in your next map layout.
I leave you with one last quote, from Rick Rubin’s amazing book “The Creative Act”:
No matter what tools you use to create, the true instrument is you. And through you, the Universe which surrounds us, all comes into focus.”
• If you have any questions or just want to chat about design, please find me after this session or at the banquet. Thank you so much for coming, and Happy Mapping!